Using For Loops in R
One of the most initially confusing aspects of R is using loops to repeat a chunk of code. I hope you will find this tutorial helpful and start to understand the power loops give to our code. For the sake of this tutorial, I am going to assume that you have already been introduced to if statements. If not, just note that if statements are bits of code that only execute if the logical statement given is true. So let’s start with a straightforward example, where we add up all of the numbers in a vector (which can be done with the sum function). So, we will start with an arbitrary vector, “x”, and also create a “total” variable that will count the sum. Now in the for loop, we specify the changing variable in the for loop code “i”. The values that i will take are the elements of our x vector. The first time the loop runs, i will be 5; the second time i will be 6, and so on. When the loop finishes, each number in the “x” vector will have been added to 0, which is just the sum of the “x” vector.
x <- c(5,6,7,4,2,6) # The vector that will dictate the values of i
total = 0 # A placeholder variable we will modify in the for loop
for(i in x){ total = total + i} # The loop itself
print(total) # A print statement
output: 30
With the addition of conditional statements, we can add additional flexibility to the program. For example, we can identify how many of the numbers in the vector are above 5. Here we follow a similar process by starting with a variable that will be modified, which is “above_5” in this code. Then we loop through the vector again, but this time we have an if statement that only adds 1 to the variable if i is above 5. In this way, we are able to count how many of the numbers in the vector are above 5. Also, note that I put different elements of the loop on separate lines to improve readability.
above_5 = 0
for(i in x){ # Start of for loop
if(i > 5){above_5 = above_5 + 1 # Start of if statement
} # End of if statement
} # End of loop
print(above_5)
output: 3
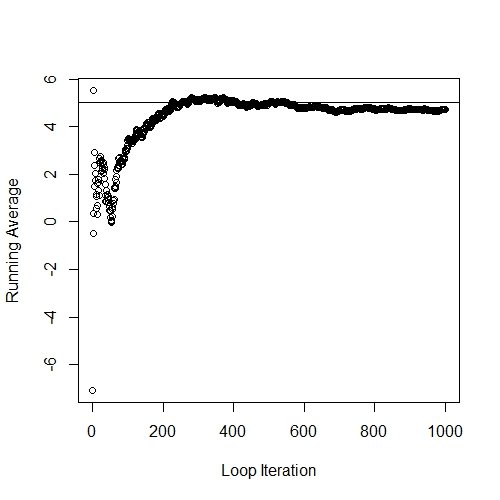
One thing I often find myself doing is using a counter that counts how many times the loop has run. You will find this useful in a variety of situations, such as when you need to reference the indexes of another vector, or simply want to use that number in a calculation. I most often use this counter to save the output of a calculation as it is running. I want to finish by giving a real example of what you can do with a for loop, although I understand that you may not necessarily want to do this yourself. Let’s say we want to calculate a running average for a stream of data; in this example, our data comes from the rnorm() function with 1000 numbers, a mean of 5, and a standard deviation of 10. We will once again start by defining some variables before we create the loop, “total”, which starts at 0, “counter”, which starts at 0, and “mean”, which is a vector of 0 with a length equal to the length of the “x” vector. Now we will once again make a vector that calculates a total, but we will also assign each total divided by the counter to an index of the “mean” vector (the total divided by the counter is the mean). When you plot this, you will see that the running average is initially under the true mean of 5, but over time the running average converges to the true mean. I hope this example gives you a taste of how flexible loops can make the R language!
set.seed(1234) # Makes the rnorm() function give consistent random numbers
x <- rnorm(1000,5,10) # Random number generator
total = 0 # Initiates the total variable
counter = 0 # Initiates the counter variable
mean = rep(0,length(x)) # Initiates the mean vector
for(i in x){ # Start of the for loop
counter = counter + 1 # Counts every loop
total = total + i # A running total
mean[counter] = total/counter # The current mean inserted into the “mean” vector
} # End of the loop
plot(x = 1:length(x),
y = mean,
xlab = "Loop Iteration",
ylab = "Running Average") # Plots the progress of the for loop
abline(5,0) # Creates a line extended horizontally designating the true mean
output:

